



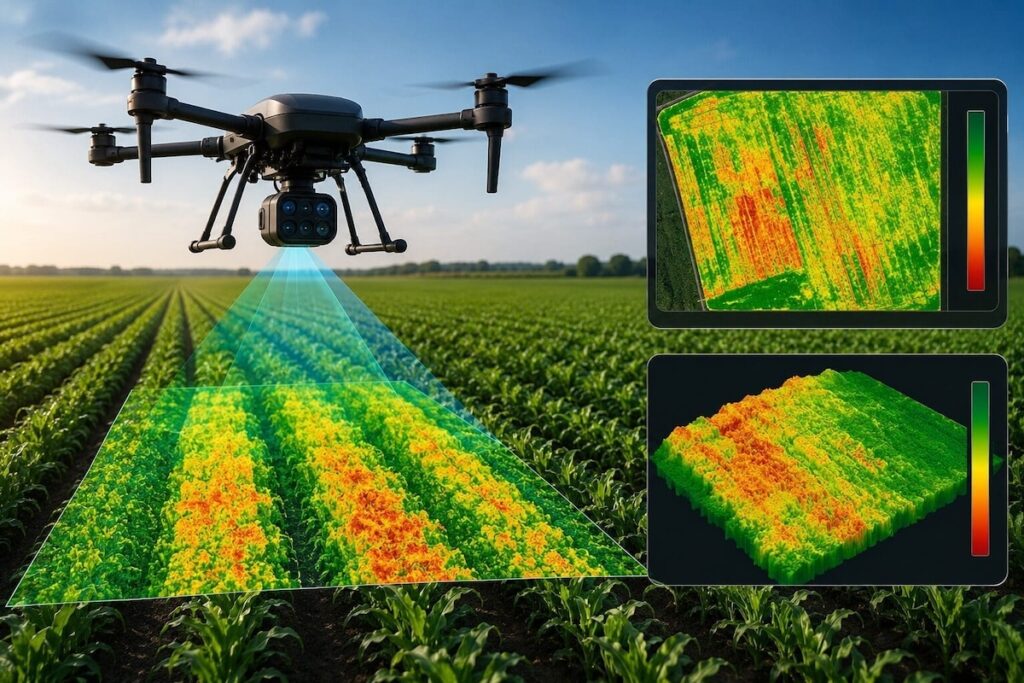
Blue Nose Aerial Imaging supports the use of drone-based data collection for precision agriculture, where multispectral imagery can provide growers with information about crop condition that is not apparent through conventional visual inspection. Read more >>
By measuring plant reflectance at specific wavelengths, multispectral systems can help identify variations associated with nutrient availability, water stress, disease, and other factors affecting crop development.
Using Multispectral Imaging to Assess Plant Health
Visual crop scouting can identify many problems once physical symptoms have developed. Multispectral sensing provides another layer of information by recording narrow wavelength bands within visible light and the near-infrared (NIR) spectrum.
Healthy foliage reflects substantial quantities of NIR energy, while vegetation experiencing stress typically produces lower reflectance. These spectral relationships can be expressed through vegetation indices that allow differences across a field to be mapped and compared.
Common measurements include the Ratio Vegetation Index (RVI) and Normalized Difference Vegetation Index (NDVI). Measurements incorporating the red-edge portion of the spectrum can provide additional information about chlorophyll. The Normalized Difference Red Edge (NDRE) index uses this region between red and NIR wavelengths to identify relatively small changes associated with plant condition.
Monitoring Early-Stage Lettuce Crops
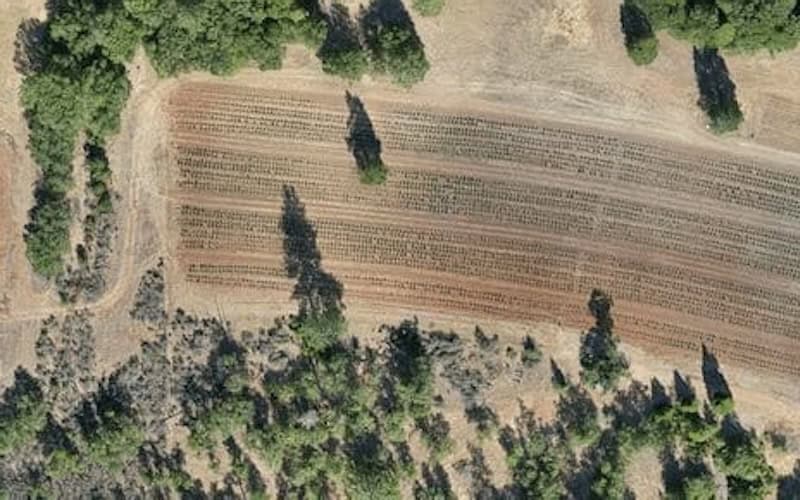
A 2026 study described the use of multispectral drone imagery to evaluate an 8.47-acre baby-lettuce field in California. A Sentera 6X multispectral sensor was integrated with an IF800 Tomcat drone for a seven-minute survey.
During the mission, the system collected high-resolution RGB and multispectral imagery that was subsequently processed into an orthomosaic and corresponding spectral maps. The sensor’s 20 MP RGB camera documented uneven crop development and gaps within the field, while the multispectral dataset enabled analysis using the Chlorophyll Index Green (CIG).
CIG evaluates the relationship between green and NIR reflectance to characterize chlorophyll content, which is associated with plant nitrogen status and photosynthetic capacity. Lower CIG measurements identified sections that could be experiencing insufficient nutrients or water stress, providing information that could be used to direct further inspection and localized treatment.
NDVI mapping was also produced from the flight data. Analysis indicated that the majority of the surveyed crop was healthy. After adjustment of the NDVI histogram, 5.72 acres were identified as having positive NDVI measurements, providing a quantitative assessment of vegetation biomass across the field.
Understanding Key Vegetation Indices
Different spectral indices provide information suited to particular aspects of crop assessment.
Chlorophyll Index Green (CIG) is particularly responsive during the initial stages of plant development. Differences in CIG can indicate variations in chlorophyll and nitrogen. Higher measurements are associated with stronger growth, while lower measurements can indicate conditions related to nutrient shortages, limited water, or disease.
Normalized Difference Vegetation Index (NDVI) compares reflected NIR energy with absorbed red wavelengths. Dense and healthy vegetation generally produces higher NDVI measurements, whereas lower measurements can correspond with reduced plant density or stressed crops.
Normalized Difference Red Edge (NDRE) incorporates the red-edge wavelength region, which is sensitive to variations in chlorophyll. This sensitivity can allow crop stress to be identified at stages when NDVI differences may be less pronounced.
Turning Spectral Measurements into Crop Management Decisions
Multispectral mapping can convert differences in plant reflectance into spatial information that supports specific agricultural decisions.
CIG mapping can locate sections of a field showing signs consistent with nitrogen deficiency. Fertilizer can then be directed toward areas where it is required rather than applied uniformly, potentially reducing unnecessary inputs and associated costs.
Spectral differences can similarly indicate water stress. This information can support variable-rate irrigation by showing how vegetation responds to water availability throughout a field. Mapping these patterns may also assist with identifying irrigation problems such as leaks or uneven distribution.
Changes in chlorophyll and unusual spectral responses can provide early indicators of pest activity or disease. Locating affected areas before symptoms become widespread gives growers an opportunity to investigate and intervene at an earlier stage.
Multispectral sensors can also distinguish weeds from cultivated plants based on differences in their spectral characteristics. Identifying weed distribution supports localized removal and can reduce unnecessary herbicide application. Biomass calculations derived from NDVI and CIG measurements can additionally contribute to crop-yield estimation.
Following storms or other damaging events, spectral maps can create detailed spatial records of crop condition. These datasets may provide supporting evidence when documenting agricultural losses for insurance purposes.
Drone-Based Multispectral Surveys
Satellite platforms have supplied multispectral agricultural imagery for many years, but their usefulness for individual field interventions can be constrained by spatial resolution, revisit frequency, and cloud conditions.
Drone-mounted multispectral sensors provide centimeter-level spatial resolution and allow flights to be scheduled according to operational requirements. Flight parameters can also be selected for the field and sensing task, giving growers access to crop information at a scale suited to precision management.
This flexibility enables repeated surveys to be conducted when crop conditions require closer examination rather than according to a predetermined satellite pass.
Improving Yield Decisions with Multispectral Data
Drone-based multispectral imaging provides a method for evaluating crop health through reflectance characteristics that may change before visible symptoms emerge. Measurements related to chlorophyll, biomass, and vegetation condition can identify areas affected by nutrient deficiencies, inadequate water, pests, disease, or weed competition.
For precision agriculture applications supported by Blue Nose, converting these measurements into mapped field information can help growers determine where intervention is required. Targeted fertilizer and irrigation applications can reduce unnecessary inputs, while earlier identification of developing crop problems can support measures intended to protect yield.
As multispectral sensing and data-analysis capabilities continue to develop, drone-derived spectral information provides an increasingly detailed basis for evidence-led crop management.
Read How Multispectral Drone Data Improves Crop Yield Decisions here.