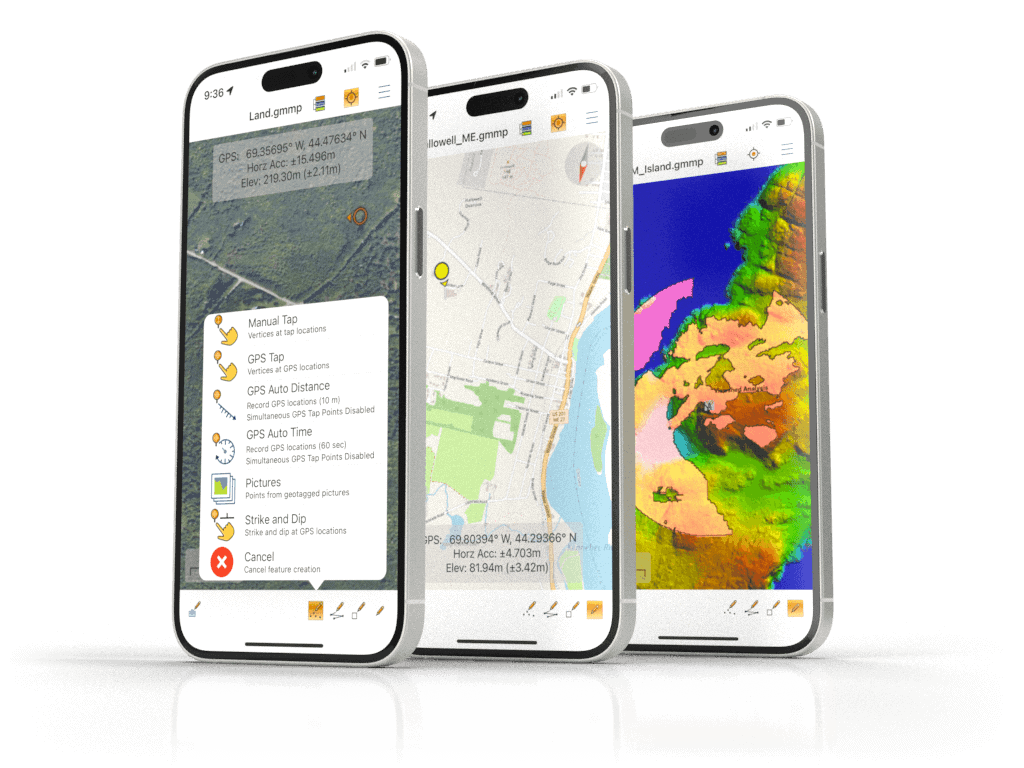


Accurate assessment of forest density is crucial for monitoring ecosystem health, managing resources, and mitigating wildfire risks. Traditional field surveys are labor-intensive, but advancements in remote sensing — particularly lidar — offer a more efficient alternative. Read more >>
By leveraging lidar’s ability to penetrate the canopy, analysts can generate detailed density maps that reveal both vegetation cover and ground features beneath.
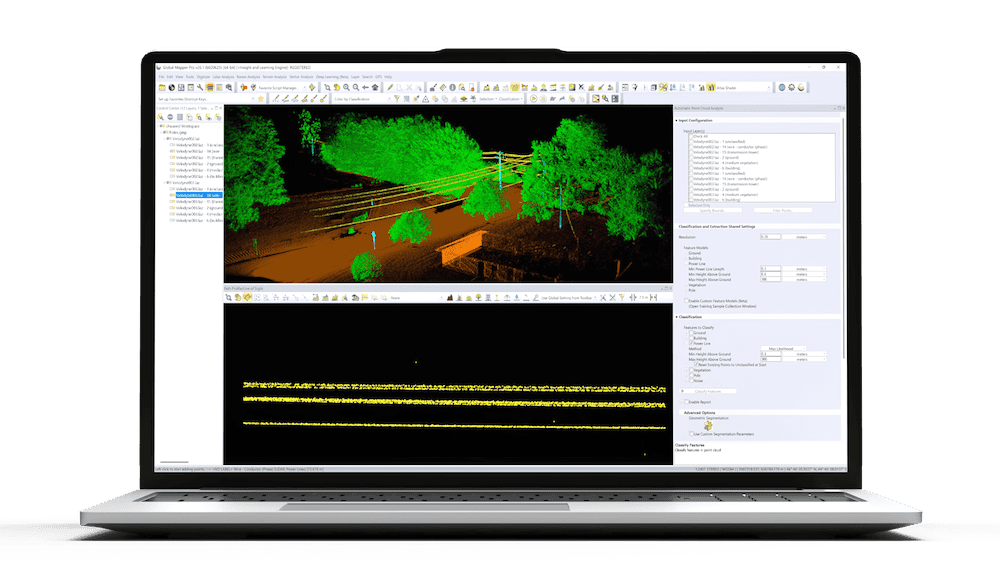
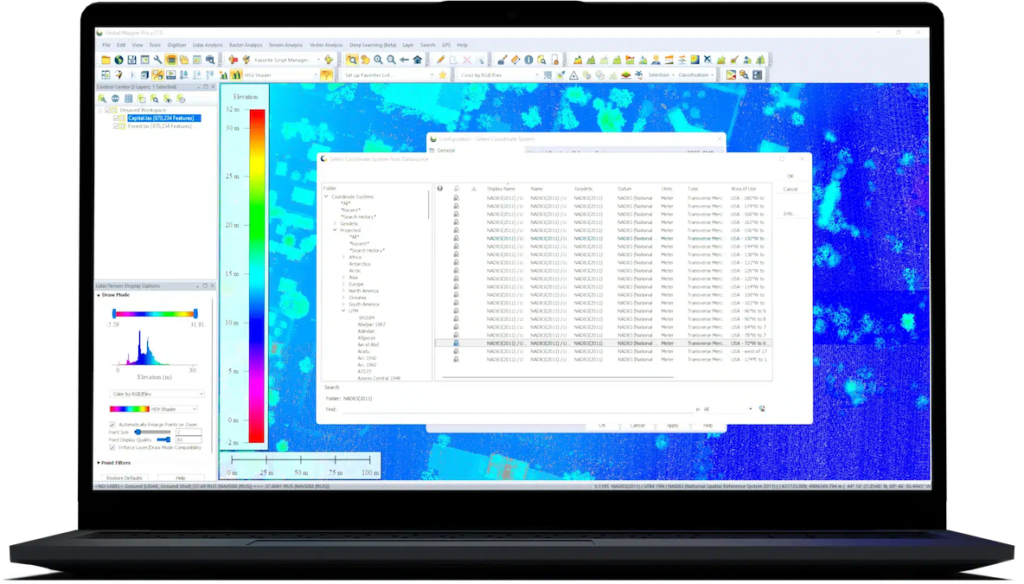
Lidar data is commonly used to classify forest structures, allowing for precise measurement of tree proximity, canopy width, and overall biomass distribution. While Blue Marble Geographics‘ Global Mapper Pro supports both photogrammetric and traditional lidar point clouds, this workflow focuses on traditional lidar due to its superior canopy penetration.
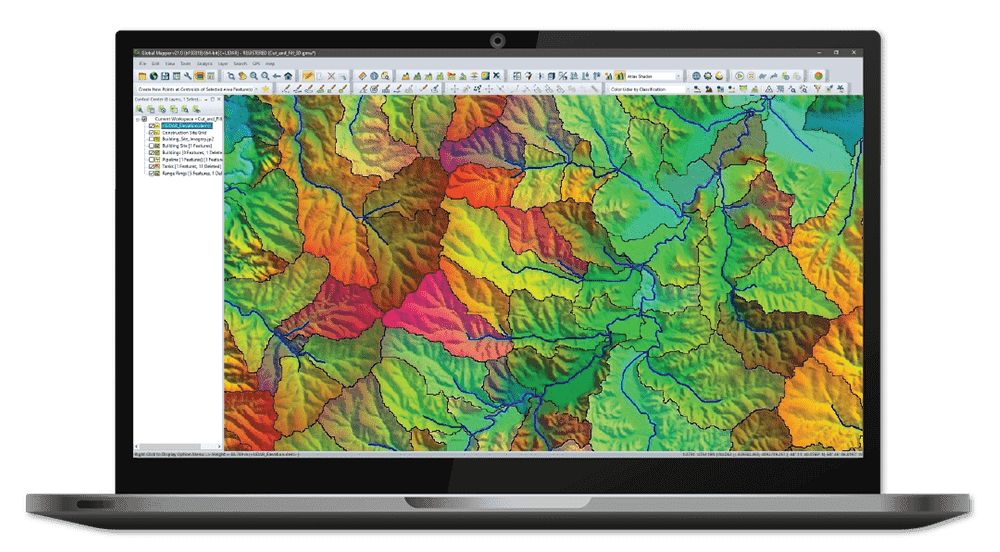
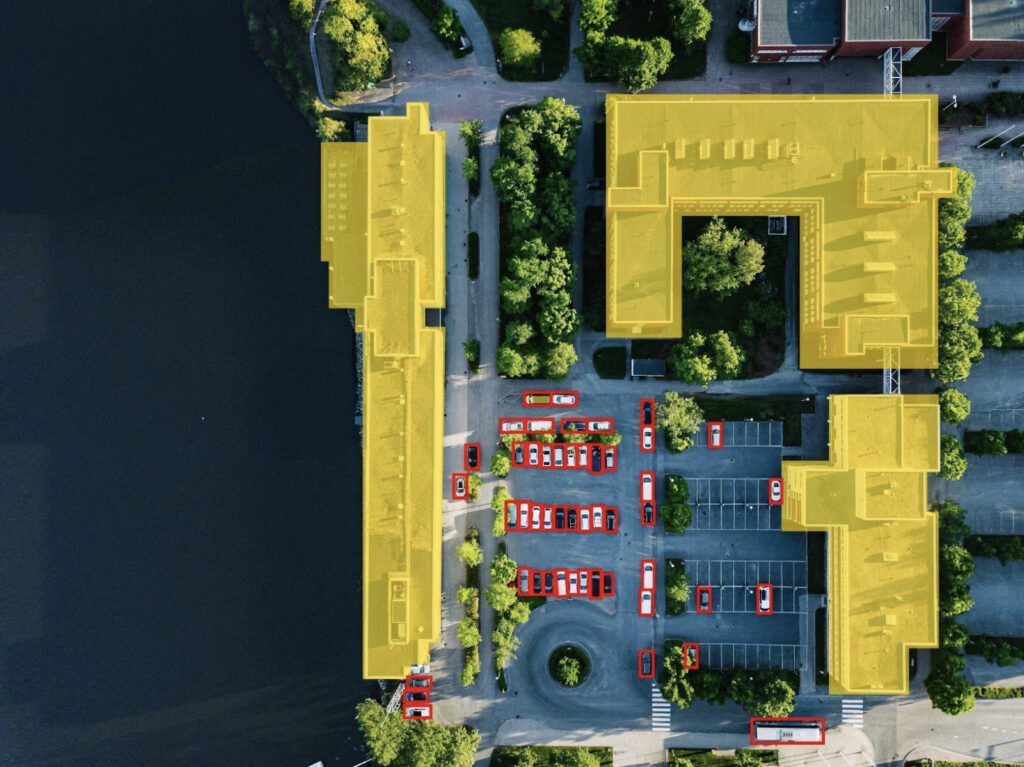
Forest density maps are typically used to identify individual tree spacing, but additional insights can be gained by analyzing clusters based on attributes such as height and canopy width. The software’s Draw Lidar by Point Density setting offers a broader perspective, visualizing vegetation density without distinguishing individual trees—a useful approach for assessing ground cover.
Creating a forest density map from lidar in Global Mapper Pro follows a structured three-step process:
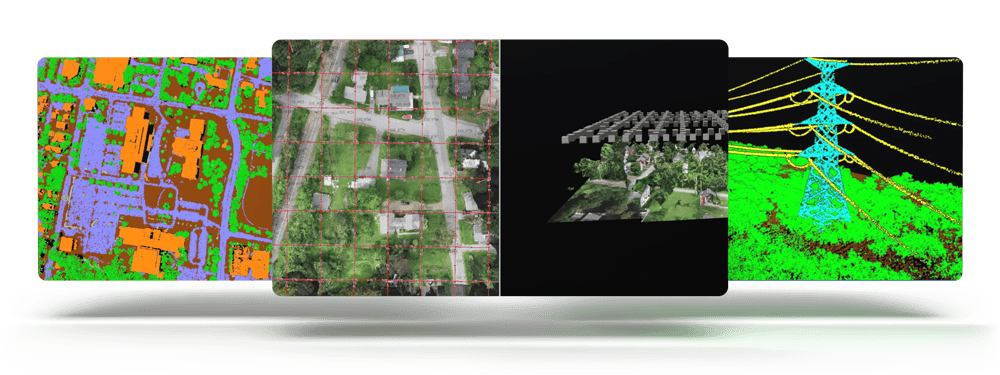
- Classify the Point Cloud: Distinguish between ground, vegetation, and other point classifications to isolate relevant data.
- Extract Individual Trees: Use the Automatic Extraction tool to generate a point feature for each detected tree.
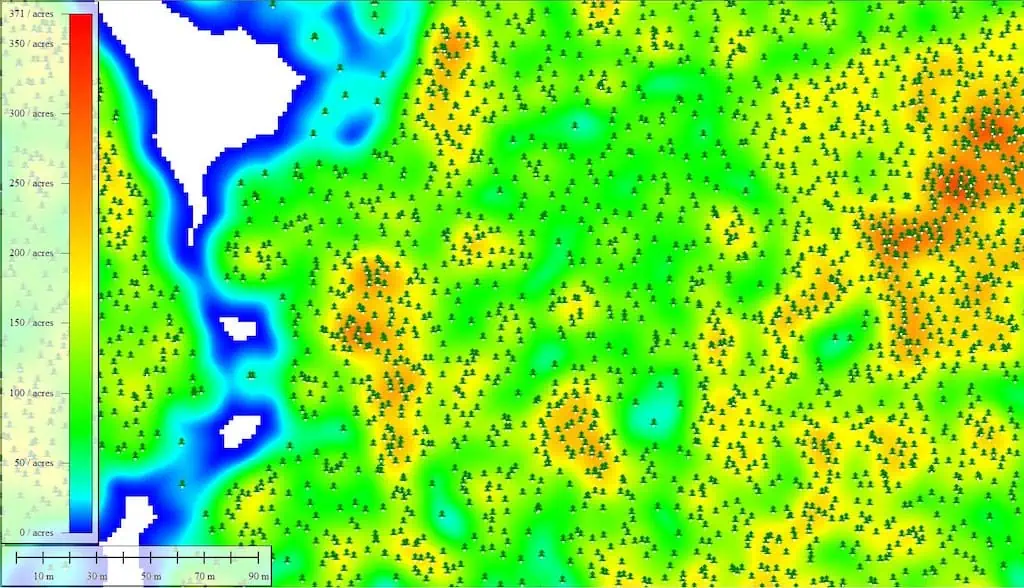
- Generate a Density Grid: Utilize the Density Grid tool to compute tree density and visualize spatial distribution patterns.
As lidar technology continues to evolve, its applications in forestry promise greater accuracy and efficiency, reinforcing its role as an indispensable asset for environmental analysis.
Read the full article, or visit the Blue Marble Geographics website.