


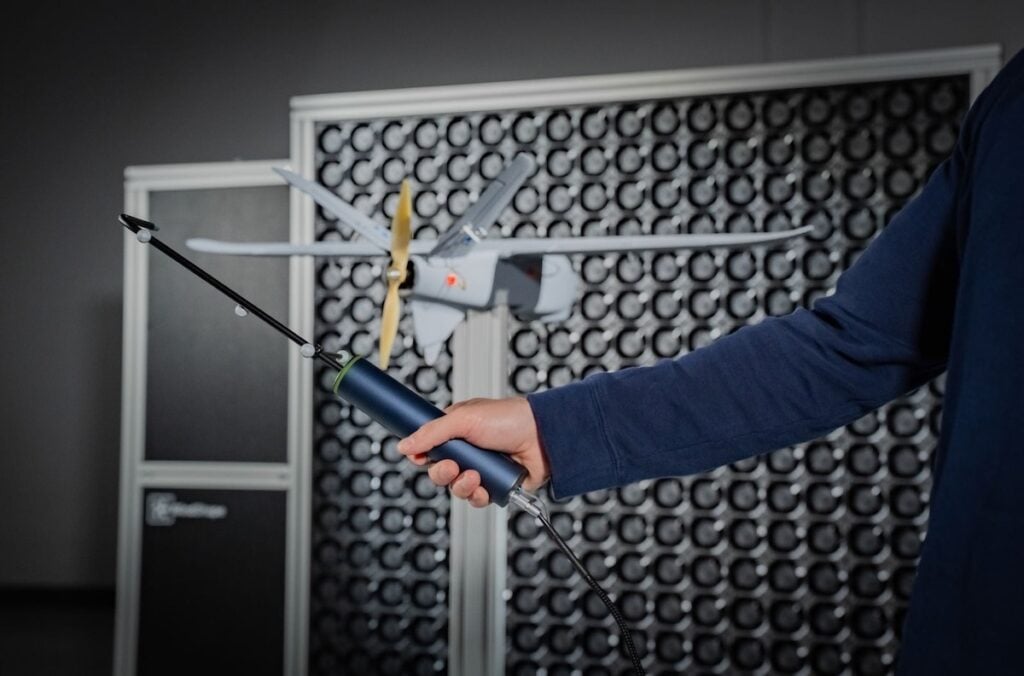
Accurately measuring airflow in three dimensions is an important part of wind tunnel testing, particularly when evaluating turbulent conditions or validating computational fluid dynamics (CFD) simulations. The WindProbe 3D from Tyto Robotics combines multi-hole pressure sensing with motion tracking to capture wind velocity measurements and map airflow across a test section in real time.
The system provides a method of examining wind profiles at different positions and angles, including around objects such as propellers, airfoils, and drones. By associating velocity measurements with their precise spatial locations, engineers and researchers can build quantitative representations of airflow rather than relying solely on visual observation.
Challenges in Wind Tunnel Flow Measurement
Conventional flow visualization techniques include smoke, lasers, and tufts. While each method has practical applications, a common limitation is their reliance on visual observation rather than directly producing quantitative airflow measurements.
Analyzing wind behavior around a specific object introduces additional requirements. Test configurations often need to accommodate the object’s geometry, with tufts attached to surfaces, smoke directed toward particular locations, or measurement probes positioned around the object.
These considerations can make it difficult to characterize airflow throughout a test section, particularly when measurements are required across multiple positions.
Wind tunnel testing is also widely used to validate CFD simulation results. However, small differences between the simulated environment and the physical test setup can cause airflow to behave differently from predicted conditions.
Without measurements covering the wind profile, determining how closely the physical airflow corresponds to the simulation can be challenging.
Measuring Three-Dimensional Airflow With Multi-Hole Pressure Sensing
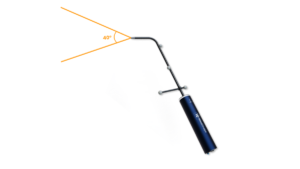
The WindProbe 3D uses a multi-hole pressure sensor with five openings at its tip and a 40-degree acceptance cone.
This configuration allows the instrument to measure airflow approaching from different angles and capture velocity vectors along the x, y, and z axes.
Unlike a conventional Pitot tube, which measures airflow directed into its opening, the five-hole configuration supports measurements across a wider range of flow directions. This is particularly relevant when examining turbulent airflow, where local wind direction can vary.
The WindProbe operates at an acquisition frequency of 200 Hz, providing the temporal resolution needed to capture rapid changes in wind velocity.
Depending on the model, the instrument supports wind speed measurements ranging from 1 m/s to 60 m/s.
The probe is supplied pre-calibrated and can be paired with a Tyto Robotics WindShaper using a single USB cable for power and communication.
Spatial Tracking Across the Test Section
In addition to measuring airflow velocity, the WindProbe incorporates spatial tracking that associates measurements with their positions in three-dimensional space.
Motion capture markers positioned along the probe’s arm allow motion capture cameras to determine its location as it moves through the test section.
Corresponding markers are also installed on the WindShaper, enabling the software to establish the probe’s position relative to the wind source.
This tracking arrangement allows measurements to be collected while the probe is moved, rather than requiring it to remain fixed at individual measurement locations.
Airflow can consequently be mapped along the downstream axis and across the horizontal and vertical axes of a measurement plane.
The same approach can be used to collect wind measurements around objects positioned within the test section, including propellers, airfoils, and complete drones.
WindVision Software for Airflow Mapping and Visualization
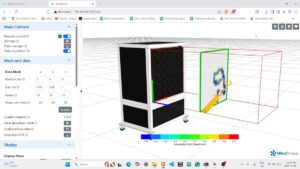
Measurement acquisition, spatial tracking, and data visualization are managed through Tyto Robotics’ WindVision software.
Users define the dimensions of the wind tunnel test section and specify the measurement plane within the software. The probe can then be moved through the selected area while velocity measurements are recorded and displayed in three-dimensional space.
To assist with positioning, the WindProbe incorporates an LED strip that provides visual guidance relative to the defined measurement plane.
The LEDs indicate the probe’s position using three colors:
– Red: The probe is far from the measurement plane.
– Yellow: The probe is approaching the measurement plane.
– Green: The probe is positioned on the measurement plane.
This feedback helps operators maintain the intended measurement position while collecting airflow data.
Adjusting Spatial Resolution With Voxels
WindVision allows users to configure the spatial resolution of their measurements using voxels.
A voxel represents a value within a three-dimensional volume, functioning similarly to a pixel in a two-dimensional image.
Increasing the number of voxels provides greater spatial granularity, allowing more detailed examination of variations in the wind profile.
Conversely, selecting a lower resolution reduces the number of voxels that must be filled, allowing measurements to be completed more quickly when a broader overview of airflow conditions is sufficient.
The WindProbe system can measure velocity vectors in volumes as small as 1 cm³. At this smallest measurement setting, the system supports up to 27 million voxels within the measurement plane.
This configurable resolution allows the measurement process to be adapted according to the level of detail required.
WindVision also supports exporting collected measurements in **.csv** and **.vtk** formats. These files can be opened and analyzed using external software such as ParaView, allowing further examination and visualization of the recorded airflow data.
Practical Application of Wind Shear Simulation for Drone Testing
One potential application of three-dimensional wind measurement is evaluating drone behavior under changing wind conditions.
For example, a drone intended to clean windows on tall buildings may encounter substantial variations in wind speed during operation.
Wind speeds generally increase with altitude, exposing the upper sections of buildings to stronger winds. When airflow interacts with a building, sharp velocity gradients can develop, creating wind shear conditions that may be difficult for a drone to navigate.
Testing these conditions before operating near buildings provides an opportunity to examine aircraft responses without exposing the drone or surrounding structures to the same operational risks.
Generating a Wind Speed Gradient With WindShaper
A Tyto Robotics WindShaper can be used to reproduce a wind speed gradient within a controlled test environment.
For example, a 2 x 2 WindShaper module configuration can be programmed with different fan speeds across its two sides:
– Left-side fan modules operating at 2 m/s.
– Right-side fan modules operating at 6 m/s.
The difference in airflow velocity creates a steep gradient between the two sides, simulating wind shear.
The WindProbe can then be positioned in front of the WindShaper to measure the resulting airflow.
As the probe is moved across the defined measurement plane, WindVision generates a real-time visualization of the wind profile, allowing the operator to examine the velocity distribution produced by the fan configuration.
Once the airflow conditions have been measured, a drone can be flown from left to right in front of the WindShaper to evaluate its response to the changing wind speeds.
The exercise provides an opportunity to observe aircraft behavior under simulated wind shear conditions and practice recovery maneuvers.
Quantitative Airflow Data for Wind Tunnel Testing
Combining five-hole pressure sensing, a 200 Hz acquisition frequency, and three-dimensional motion tracking allows the WindProbe 3D to associate wind velocity vectors with specific locations throughout a test section.
This approach provides engineers and researchers with quantitative airflow data that can complement conventional flow visualization techniques and support comparisons between physical wind tunnel conditions and CFD simulations.
Through WindVision’s configurable spatial resolution, real-time visualization, and data export capabilities, measurements can be collected and examined at different levels of detail.
For applications ranging from airflow analysis around individual components to the simulation of wind shear during drone testing, the system provides a means of mapping three-dimensional wind profiles and assessing the conditions generated within a wind tunnel.
Read How to Measure Wind in 3D With the WindProbe 3D on the Tyto Robotics website.