


Amanda Lind at Blue Marble Geographics explains the automated method of extracting curbs as line features from elevation data using Global Mapper.
There are two different methods of extracting curbs as line features from elevation data using Global Mapper. This piece focuses on the more automated method that takes advantage of the Breakline tool’s ability to create line features where the curb changes the slope from the flat road. The other manual extraction workflow uses the Path Profile tool to place line vertices along the curb. Both methods create line features with elevation attributes.
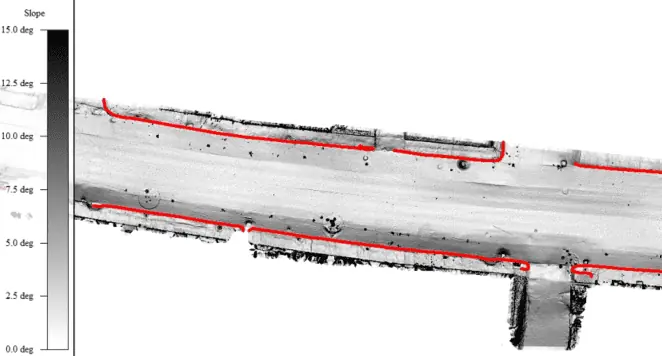
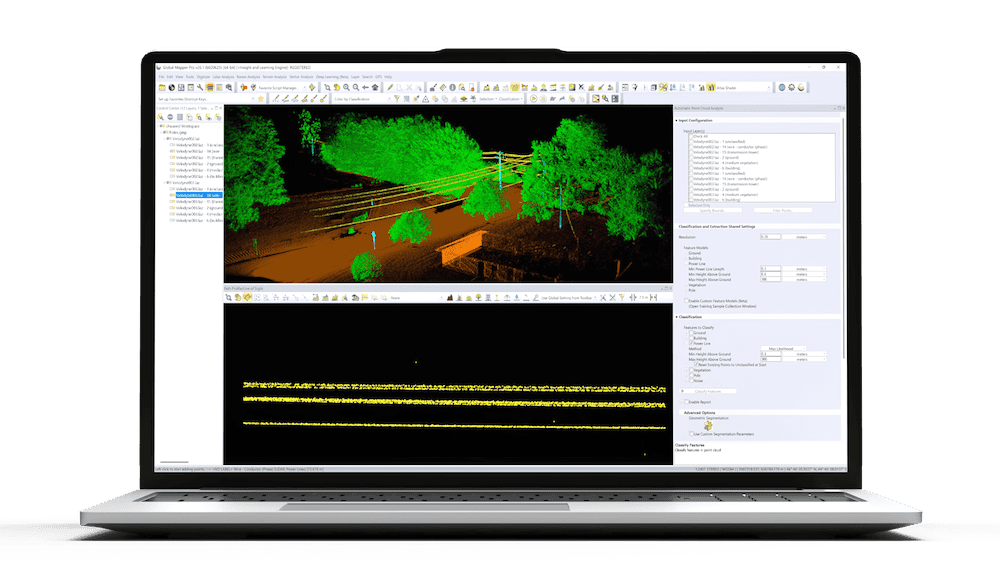
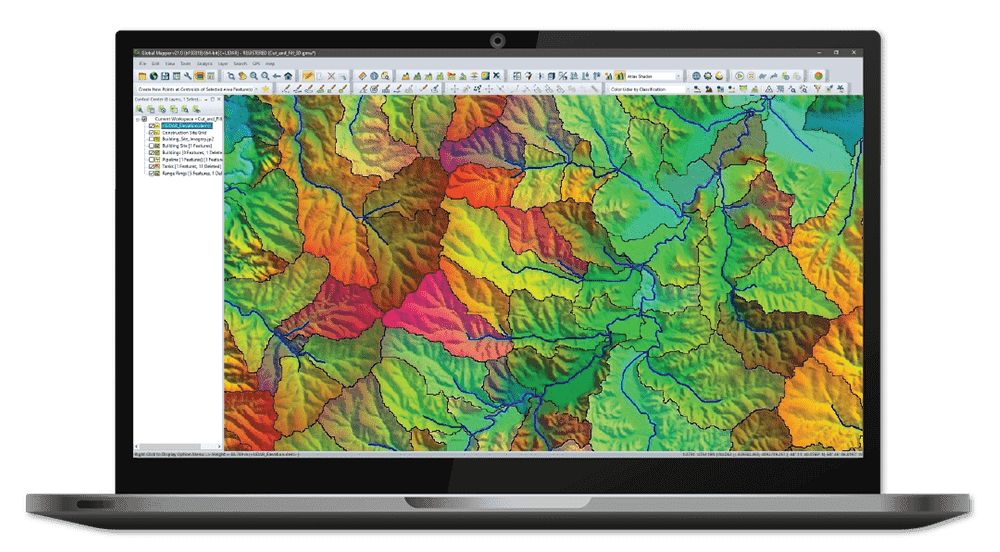
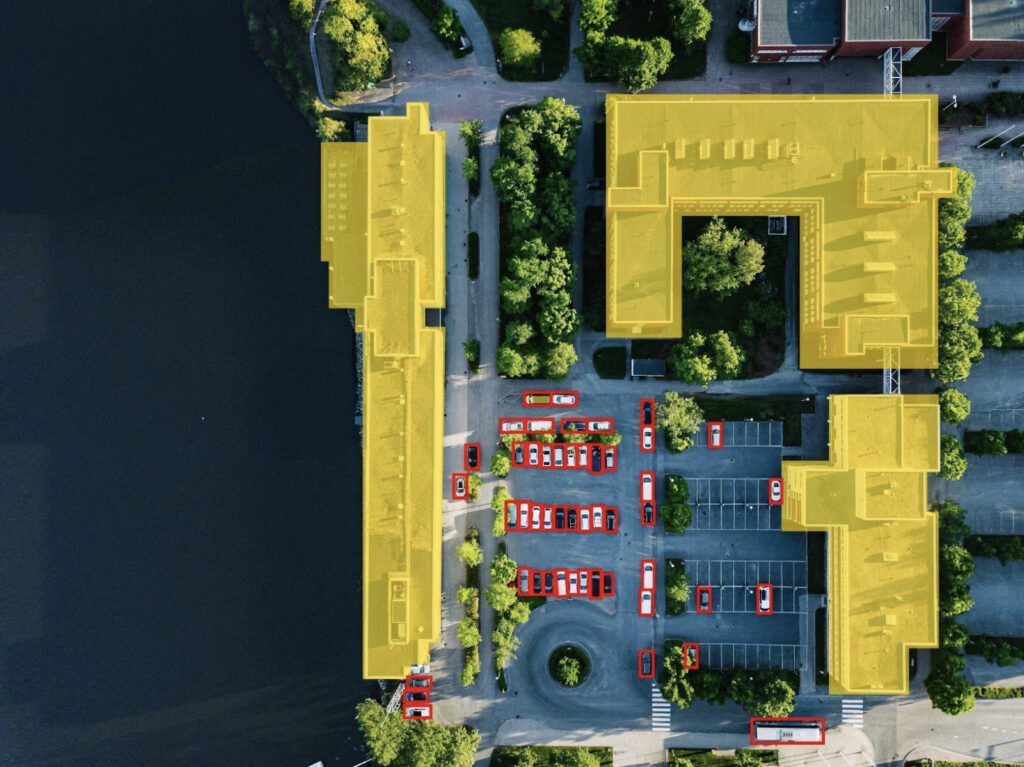
The Breakline tool analyzes elevation grids to find breaklines, seen here in red. If you are starting with lidar, be sure to classify the ground points and generate the DTM grid from those points to create as smooth of a surface as possible.
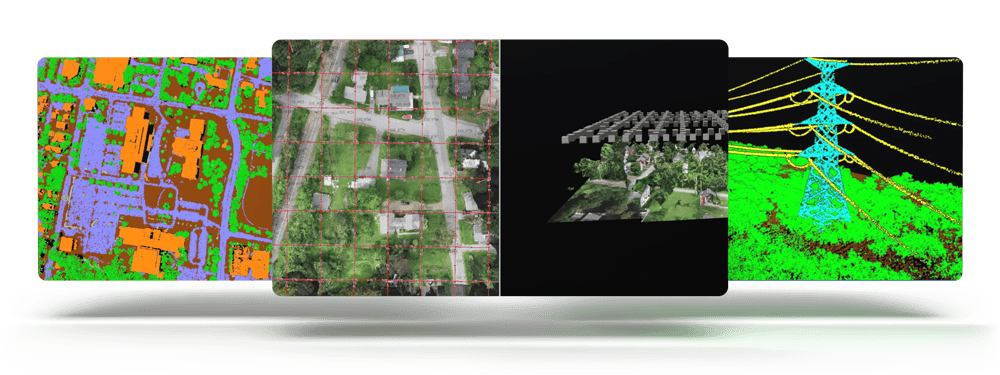
Global Mapper has automatic extraction tools for extracting buildings, trees, cables, and power poles from lidar data, but how can curbs be extracted? If you have elevation data and need to draw where the edge of the curb is, you can use the Breakline tool. Breaklines are similar to Contour lines, except instead of delineating changes in elevation, they delineate changes in slope. Curbs, at their simplest, are changes in slope in an otherwise flat area. With proper settings, the breakline tool can easily be harnessed as a curb extraction tool.
Breakline Settings
There are three different breakline methods built into the tool, but the focus is on the last one: Find Breaklines at Any Surface Break. Looking at the Breakline Setup dialogue box choose the “Profile” curvature grid type to create lines that run parallel to the slope of the curb. The Edge Threshold settings basically tell Global Mapper how steep a slope you would like to extract from the data. Slide the Detect Threshold bar very far to the right to focus on the almost vertical cliffs that characterize curbs. Next, the Connect Threshold should be just less, or a little to the left of that. Lower this value if separate curbs are being erroneously connected. Note that the Edge Detect Threshold must be at least as large, or larger than the Edge Connect Threshold.
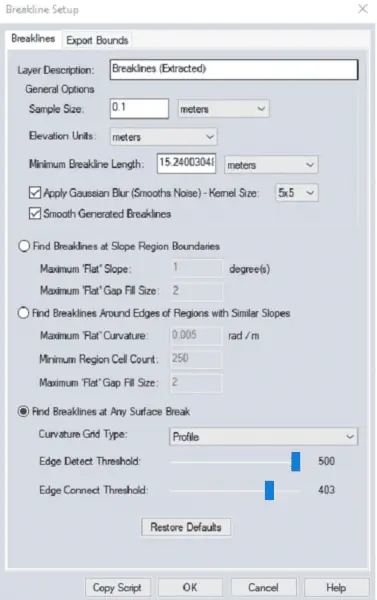
The settings used for the terrestrial lidar grid
Having difficulty generating breaklines in your data? Try creating a Curvature Grid to test and visualize your breakline settings. The Breakline tool analyzes a curvature grid created from your data to generate the breaklines. You can also use the curvature grid tool as a way to troubleshoot your settings by visualizing cell size and method. For example, try creating a 1 meter grid, then a 0.1 meter grid, and compare. The goal is to be able to see the curbs in the black and white grid. If no features are able to be discerned through what looks like TV static, then the settings need to be changed. Also, be sure the resolution of your elevation grid is high enough to show curbs.
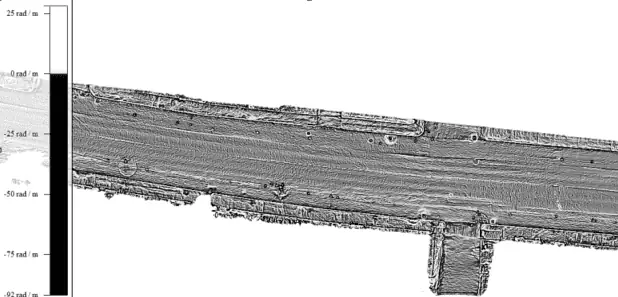

These images compare 0.1m(good) and 1m(bad) profile curvature grids. With this dataset, a higher resolution is needed to detect smooth curb features.
Generating too many line features? Be sure the Minimum Break Length value is high enough to remove all lines shorter than your shortest curb. Increasing the Edge Detect Threshold can also help remove breaklines that highlight the crest of the curve often found along the center line of roads. Breaklines can be generated along the top or base of the curb, depending on the curve of the terrain. For user’s who need precise (>6in) line features, the manual extraction method may be preferred.
Try Global Mapper Pro with a free 14-day trial today.