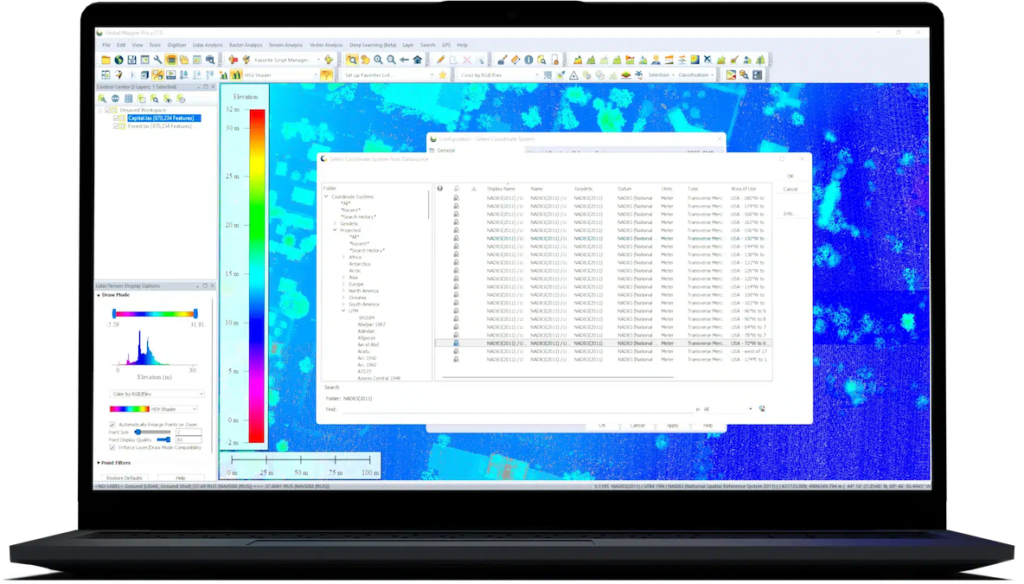


In this article, Amanda Lind from Blue Marble Geographics describes the process of classifying transmission towers in point clouds using Global Mapper as an example of how to use the segmentation tool.
Global Mapper Pro has a new tool for classifying power poles, which facilitates the classification process of more complex electrical structures. For example, transmission towers in a point cloud are not classified using the built-in pole classification tool because that tool only looks for cylindrical structures. However, there is another way they can be classified. Features in point clouds, such as transmission towers, have a “fingerprint” made up of characteristics or attributes that can be used to identify them apart from other points in the point cloud. The segmentation tool in Global Mapper Pro can identify clusters of points based on these common attributes.

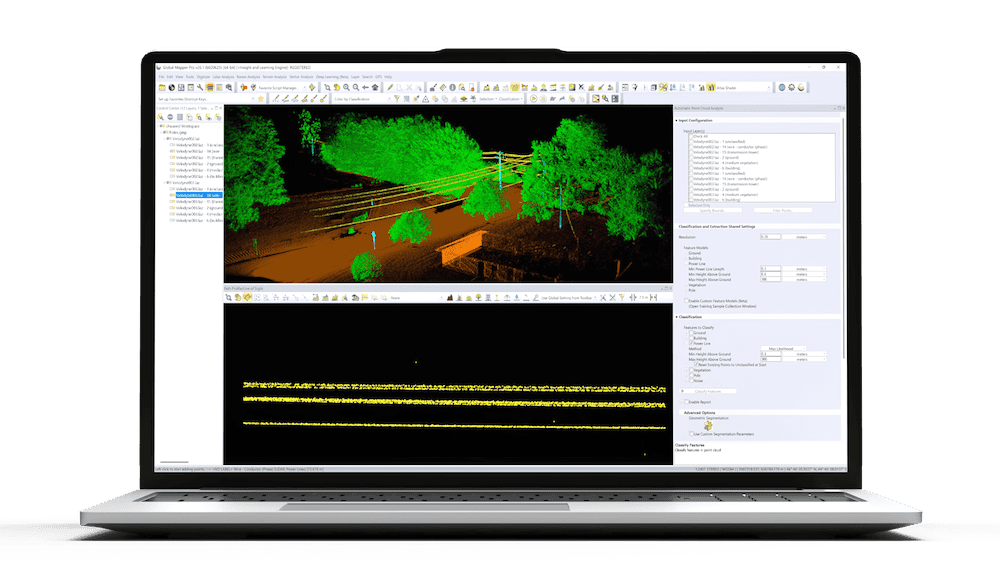
Transmission towers can be identified and classified in Global Mapper Pro using the segmentation tool.
Before classifying the transmission towers, it can be useful to first classify noise, ground, and wire points (in that order) to help eliminate non-tower points. After classification, use the Filter Lidar tool to turn off classified points and exclude them from any processing.
What is Segmentation?
Segmentation is a lidar classification method that clusters points together into groups, or “clusters”, based on common attributes. Its goal is to group together “things that are things”; for example, a car is a thing, a tree is a thing, the paint stripes on a road, the sidewalk, or a specific species of grass. Just about anything that has a different “fingerprint” of attributes from its neighbors can be classified using the Segmentation tool. For more information, consult the knowledge base.
When choosing which attributes to use from the list in the segmentation tool, choose those that are similar across your entire feature. They don’t have to be exact, the Standard Deviation setting will let you specify how much range in values a recognized feature is allowed to have, but similar. Below is an example of an undesirable attribute for our task:

The lidar points in this tower have a variety of return number values, so that attribute should not be used when segmenting for this tower.
Segmenting Transmission Towers
Transmission towers are a great example of how to use the segmentation tool because they are typically made of the relatively same material throughout their construction, so they’ll have the same attributes across the whole structure, such as color and intensity value. This means they have a consistent fingerprint across their entire structure. This fingerprint is made of attributes that can be chosen from the left side of the segmentation dialog, as shown below.

Here is a starting point when looking for settings to segment transmission towers in Lidar data that includes color.
Settings notes
Every point cloud is different, so these settings will likely need to be adjusted to fit your data. In these example settings, the resolution is set to be larger than normal because we are looking at a large, consistent structure and don’t want to highlight small features. Minimum Number of Points in Segment is low for the same reason. Maximum Standard Deviations are very low because the structure has little variation from point to point. Any point that’s significantly different from its neighbors is not likely to be part of the tower. A high standard deviation value is 3. The intensity value measures the reflectance of a surface. More specifically, intensity is a measure of how strongly the light bounced off the surface of the tower and returned to the sensor and is typically based on material. Color is weighted more highly than the other variables as it helps in distinguishing the tower from the power lines that are otherwise very similar. For point clouds without color, classify the power lines first, then filter them off before segmenting. For further clarification on what these settings mean and their uses, consult the knowledge base.
Segments are assigned a random color and are sometimes tiled according to available computer memory during processing, such as the bright green and grey tower in the background.
Once segmented, you can select individual segments (also referred to as clusters or groups) and assign a classification. Use the Segment Select tool to select the segments, holding the CTRL key down to select multiple segments.