


Tyto Robotics looks at CFD Model and experimental testing, focusing specifically on the difference between simulation and reality for a 60” UAV propeller, with results from a recent test. Read more >>

The Ansys Fluent software was used to generate a CFD model of the company’s 60” propeller, which was then experimentally tested with the Flight Stand 150 thrust stand.
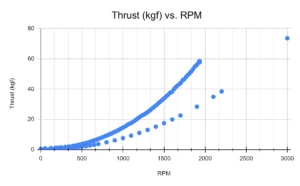
What Tyto Robotics discovered was that during tests from 1000 – 2000 RPM, the CFD simulation underpredicted thrust by 69%.
Introduction
A question the company often gets goes something like this: “We’re planning on running CFD simulations, do we still need to test our motors and propellers experimentally?”
Tyto Robotics acknowledges that they may be biased, but the answer is always yes, and for good reason. The company performs plenty of CFD simulations themselves, but acknowledge that these simulations are not a way to get definitive answers about a propulsion system, they simply give the ability to make predictions about how a motor or propeller might perform.
Simulations are especially useful to predict the effects of altering specific variables in an already well characterized system.
How big is the difference between simulation and reality? It depends on a lot of factors,like the choice of turbulence models, mesh type and sizing, boundary conditions and discretization methods used.
In this report, Tyto Robotics quantifies the difference between simulation and reality for a 60” UAV propeller, results below.

Procedure
Simulations and experimental tests were run in parallel over the course of several weeks.
The Ansys simulation was designed to mimic the experimental lab space, including the proximity of walls, obstacles and the overall size of the room. The thrust stand and propulsion system were also modeled to the exact dimensions of their live counterparts.
Each Ansys simulation took an average of 10 days to complete using a computer with a latest generation GPU. Occasionally, the simulation would fail to converge and the parameters would have to be adjusted before restarting the simulation. Overall, the dozen simulations completed took about 20 weeks to run. Preceding the simulations, the Tyto Robotics team completed 16 hours of training with a consultant.
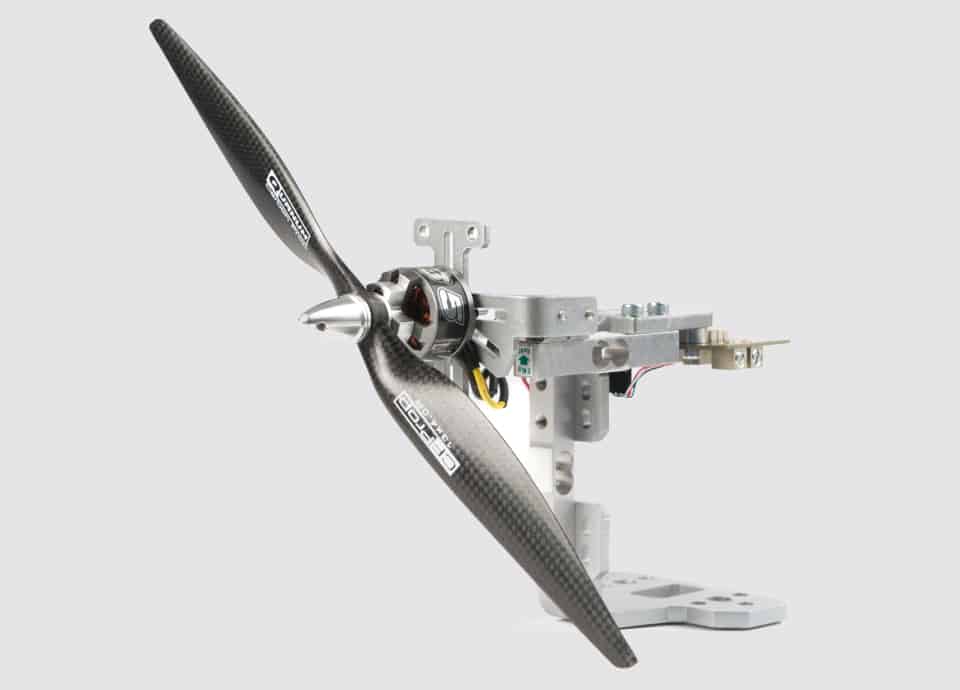
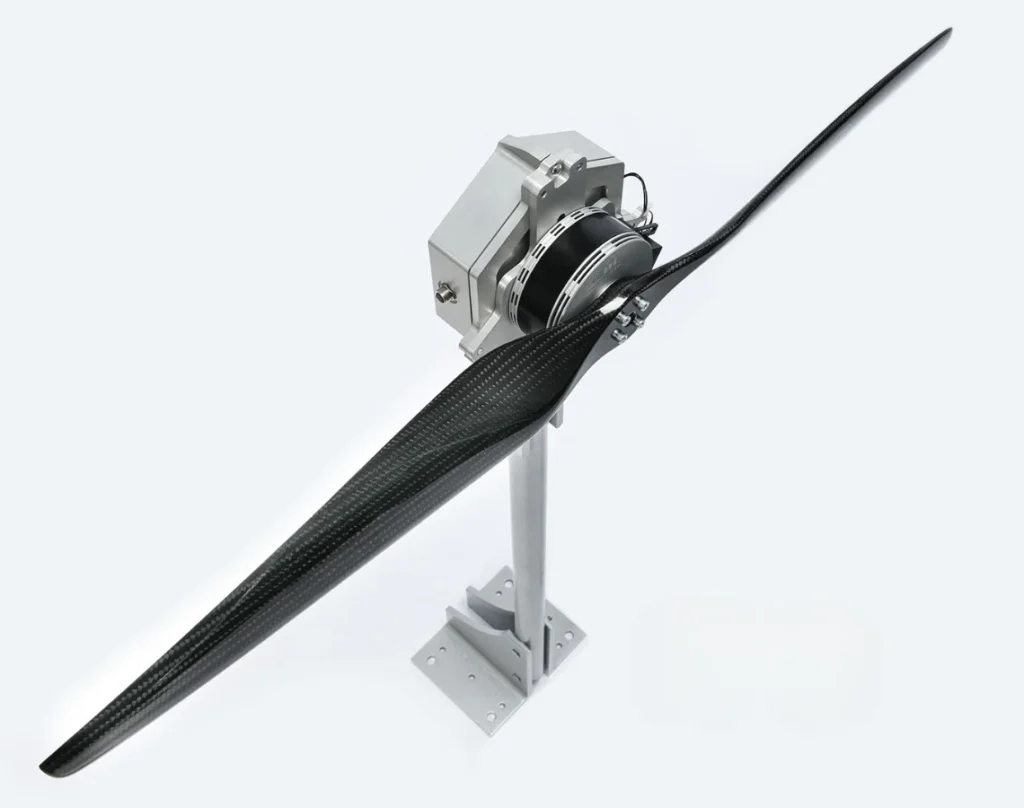
In parallel, Tyto ran experimental tests using the Flight Stand 150 thrust stand. The company used a 60kW power supply to power the stand, mounted with aTA150 motor and 60” propeller.

Specifications
Experimental Test:
Thrust Stand: Flight Stand 150 (150 kgf / 150 Nm)
Motor: TA150
Propeller: 60” diameter
ESC: Pulse P40
Power Source: 60 kW power supply from MCB Electronics
Software: Flight Stand software
Test area:
Distance from Flight Stand to back wall – 3 m
Distance from rotating domain to top wall – 3 m
Distance from rotating domain to side walls – 2.74 m
CFD Model:
Software
Ansys Fluent – Version R1 (21.1)
Geometry of Static Domain
X – 7.06 m (width)
Y – 5.1 m (height)
Z – 15.3 m (length – wall downstream of propeller to wall upstream of propeller)
Mesh
- Unstructured polyhedral mesh elements
- Total number of elements – 3,181,422
- 6 Inflation layers on propeller boundary – first layer 1.5 mm with growth rate of 1.2 (boundary layer not resolved)
Discretization Scheme
- All terms – 2nd order upwind discretization
Turbulence Model
- K-omega SST (steady-state)

Results
A Python script was developed to find a relationship between the experimental data and CFD data using least squares polynomial regression. This relationship was developed using ONLY the experimental data points available up to 1900 RPM. The objective of this regression was to generate a function as follows:

The steps undertaken to achieve this are as follows:
- Store experimental and CFD data in separate arrays with their corresponding RPM values.
- Fit a second order polynomial to both the experimental data series as well as the CFD data series.
- Use the equations of the fitted polynomials to generate evenly spaced data points for both experimental data series as well as CFD data series.
- Store the evenly spaced CFD data points in a new ‘X array’ and the evenly spaced experimental data in a new ‘Y array’.
- Use these new arrays to fit a polynomial function between ‘X array’ and ‘Y array’ using the python function np.polyfit().
The generated equations and plots for the concerned data range are presented below:
-
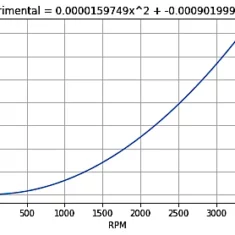
- Figure 4: Least squares curve fit of experimental thrust data
-
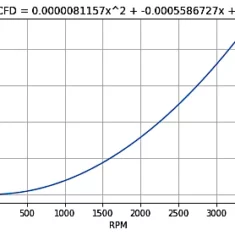
- Figure 5: Least squares curve fit of CFD thrust data
-
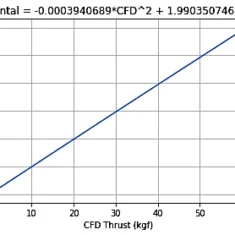
- Figure 6: Least squares regression of experimental and CFD thrust data
As seen in Figure 6, there is a linear relationship between the experimental and CFD data. The experimental thrust value is approximately twice that of the thrust value predicted by CFD.
Stand Force Calculation From Experimental Data:
This section explains how to estimate the pressure forces from a propeller on the Flight Stand structure from experimental data at a constant RPM. The process is followed for a 60 inch propeller with 2 blades on the Flight Stand 150 and the results are presented below.
Premise:
Hypothetically, if a perfectly balanced propeller attached to the force measurement unit (FMU) is spinning freely in the absence of a stand structure, ‘Mx’ & ‘My’ measurements would be zero. However, in the presence of a stand, every time a propeller blade passes by the structure, a high pressure zone is created between the propeller blade and stand. This causes the FMU to register an Mx moment. This moment can be used to estimate the maximum force on the stand due to fluid-structure interaction.
In reality, propellers are not perfectly balanced and might have one blade generating more thrust than the other (for a two blade propeller). This would result in an oscillatory ‘My’ measurement on the FMU, the maximum being when both the propeller blades are 90 degrees away from the stand (horizontal position of the propeller).
In the absence of a stand, this moment would appear as an ‘Mx’ measurement when the propeller is vertically aligned and as an ‘My’ measurement when the propeller is horizontally aligned. The magnitude of this moment due to an imbalanced propeller remains constant throughout a cycle but continuously changes in direction.
When the propeller is vertically aligned with one blade being in front of the stand, the sum or difference, (depending on how the propeller is imbalanced) between the maximum ‘Mx’ measurement and the maximum ‘My’ measurement during a full cycle, is the resultant moment generated purely due to fluid-structure interaction between the propeller and the stand. This is the method used to estimate stand force due to fluid-structure interaction.
The force on the Flight Stand 150 was estimated using this method with a 60 inch propeller mounted on it and spinning at 1932 RPM.
The forces and moments about the three axes were first calculated using load cell voltage raw values. After obtaining these values, ‘Mx’ & ‘My’ were plotted on top of each other.

In the figure above, the distance between two green dot-dash lines ‘-.’ indicates one full revolution of the propeller.
Conclusion
The results demonstrated that a CFD model was able to predict propeller thrust performance with a 69% difference from experimentally measured data.
An ideal approach to propulsion testing uses both CFD simulations and experimental tests to characterize powertrain performance. Once the experimental data is collected,a relationship can be developed between the CFD data and experimental data, which can be used to make predictions of thrust and torque values for higher RPM’s up to a certain value.
Once a relationship has been established, it can be used to make predictions about the performance of the system with slight modifications, like using a propeller with a different pitch, or operating the system at higher RPM.
In general, CFD is useful for making predictions, but it is always a good idea to validate the results experimentally.
If customers or clients would like to test motors and propellers experimentally, Tyto Robotics recommends one of the thrust stands below:
- Series 1585 – measures 5 kgf of thrust / 2 Nm of torque
- Flight Stand 15 – measures 15 kgf of thrust / 8 Nm of torque
- Flight Stand 50 – measures 50 kgf of thrust / 30 Nm of torque
- Flight Stand 150 – measures 150 kgf of thrust / 150 Nm of torque
- Flight Stand 500 – measures 500 kgf of thrust / 1500 Nm of torque
Read the original report here, or visit the Tyto Robotics website.