
FarSounder has released the following article detailing how 3D forward looking sonars (FLS) can be integrated with hydrographic data acquisition software. FarSounder’s 3D FLS solutions are essential tools for safe precision navigation of USVs (unmanned surface vessels) and AUVs (autonomous underwater vehicles).
Via straightforward integration to Qinsy, FarSounder’s customers gain access to sophisticated hydrographic processing capabilities and rich views of the incoming data streams. FarSounder’s 3D Forward Looking Sonars (FLS) offer real-time navigation and obstacle avoidance capabilities. Processed FLS data is displayed to the user in SonaSoft, FarSounder’s standalone processing and display software. Our software allows the user to interact with the data and use it to inform navigation decisions. In addition to using SonaSoft to display the data, a number of integrations are available that allow the user to view and manipulate Argos data in third party systems. This is made possible by FarSounder’s Software Development Kit (SDK). One such integration is with the hydrographic data acquisition software Qinsy, produced by QPS.
FarSounder’s SonaSoft Display
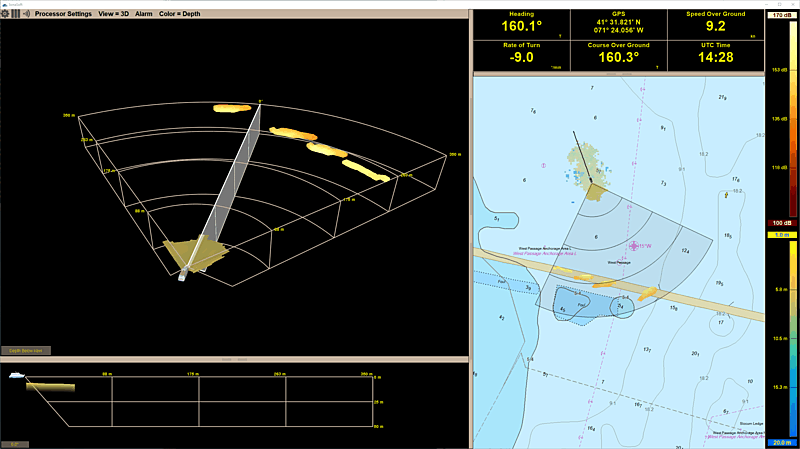
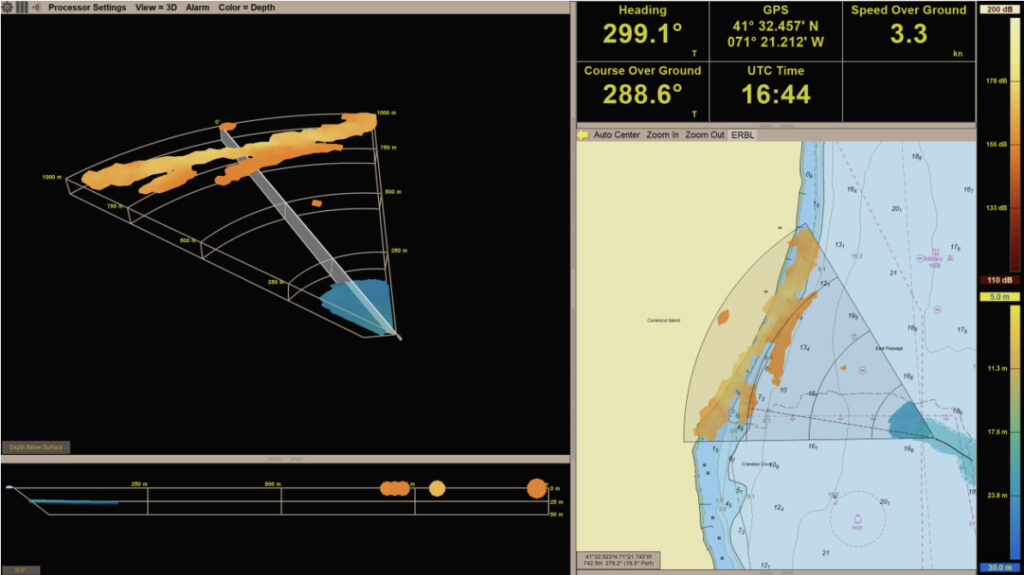
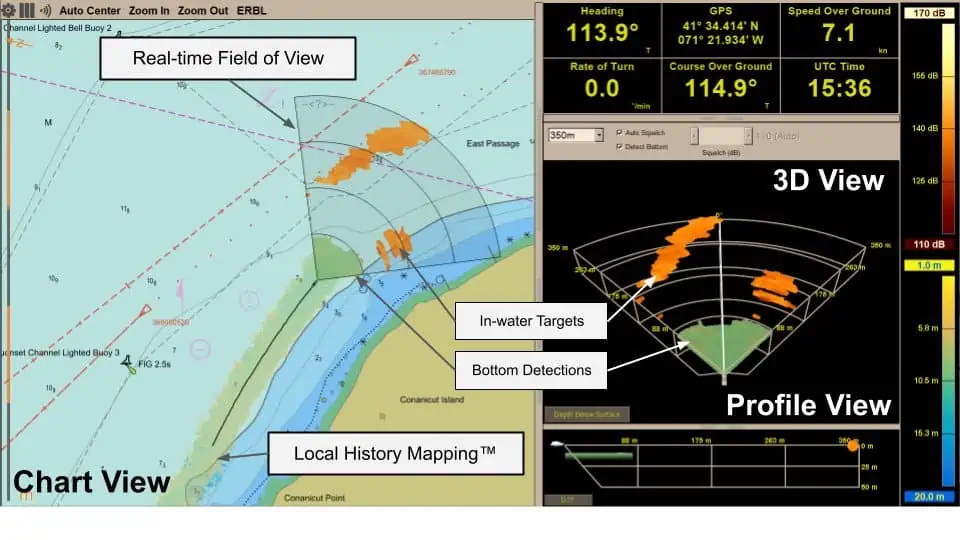
All Argos sonar systems use FarSounder’s SonaSoft processing software for processing and display. Real-time sonar data is displayed via a 3D representation in the 3D Viewer and also in a “top down” representation overlaid on an ENC chart.
Figure 1 – Screenshot of FarSounder’s SonaSoft software showing data from an Argos 350 3D FLS in Narragansett Bay, Rhode Island. Real-time detections of in-water targets and the seafloor, as well as historic Local History Mapping data are labeled in the image. The Chart View offers a top down, 2D view of the data overlaid on an ENC (Electronic Navigational Chart). On the other hand, the 3D View shows the same sonar data projected into 3D.
In addition to detecting the seafloor ahead of the vessel and navigation hazards in front of the vessel in real-time, a history of bathymetric data is stored as the vessel moves along its route. This data is an average of the seafloor detections over all of the pings that contained this area. It is most commonly displayed with color mapped to depth. Essentially, a map of the seafloor is created from the vessel’s recent history and displayed for operator use.
The data displayed in SonaSoft results from processing raw sonar data into detections corresponding to the seafloor and to in-water targets, both of which can represent hazards to safe navigation. Some history data is saved and displayed in SonaSoft, but the main use of the package is for use in real-time during navigation, e.g. for navigators to quickly get an improved understanding of the surroundings. For customers looking for a more detailed, hydrographic look at the data, Qinsy is a great option.
SonaSoft + Qinsy Integration
Qinsy is a survey planning, acquisition, and real-time hydrographics data processing solution, supporting a wide variety of industries from simple single beam surveys to complex offshore construction works. Multiple sensors can be connected to Qinsy simultaneously and a number of different hardware systems are supported. FarSounder’s Argos sonars are one of those systems. Processed point clouds and bathymetric grids can be created and viewed in real time for data review and QC.
The procedure for connecting an Argos sonar to Qinsy is described in detail in their documentation. A number of sensors corresponding to the FarSounder can be added in Qinsy, relaying in-water target detections, seafloor detections, and information from position sensors. Main control of the FarSounder system is typically via SonaSoft. However, Qinsy can also be used to control the operational parameters of the system.
Real-time Argos Data in Qinsy
Once the interface between SonaSoft and Qinsy is established as described in the linked documentation, a number of real-time views on the Argos data become available. First, the Raw Multibeam Display can be used to get a good indication of the swath width and the depth below the transducer.
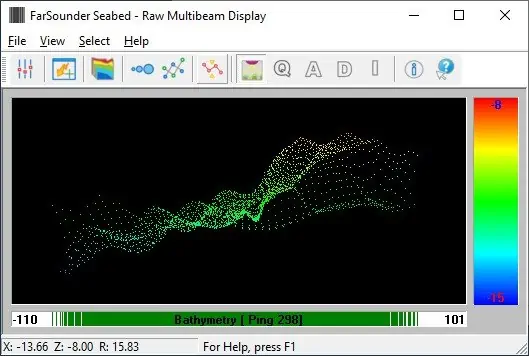
Figure 2 – Raw Multibeam Data view in Qinsy displaying a single ping of bottom detections from an Argos sonar.
The Swath System Display can be used to visualize the computed Digital Terrain Model (DTM) results, and show detected in-water target data at the same time as seafloor data.
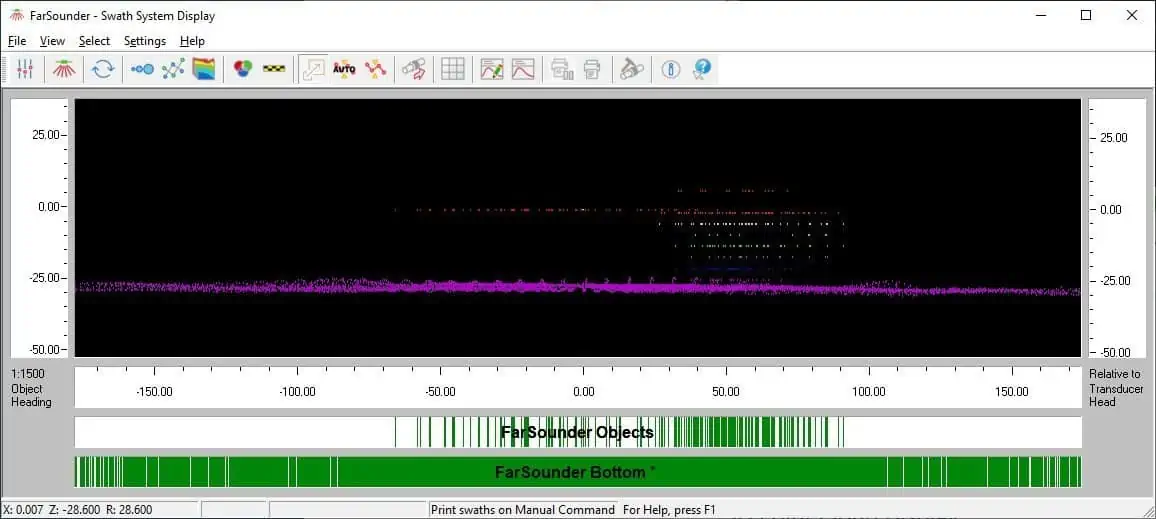
Figure 3 – Swath System view in Qinsy displaying the seafloor DTM from an Argos sonar, along with the detected in-water targets.
In both of these displays highlighted in Figures 2 and 3, the forward data, so detections along the range axis are displayed in the 2D representation. The 3D nature of the Argos data is best captured in the 3D Point Cloud Display, as in Figures 4 and 5 below:
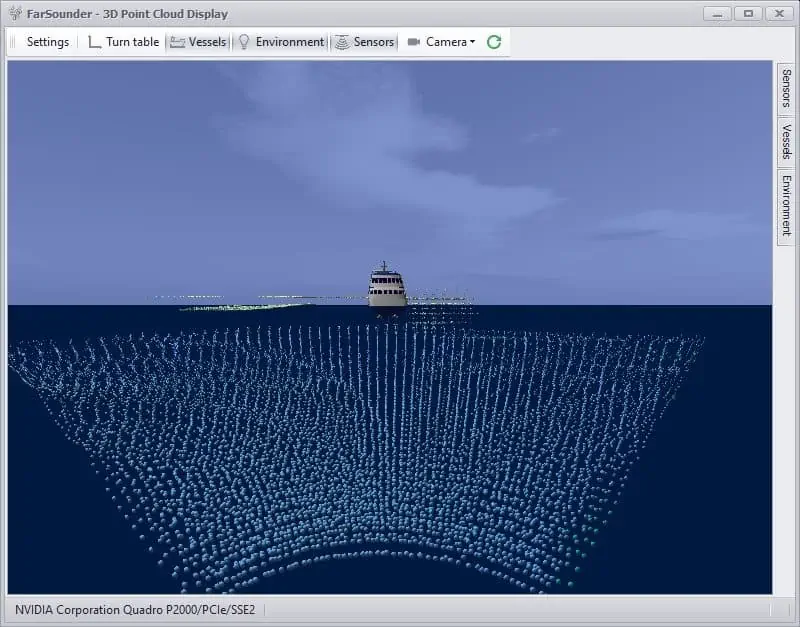
Figure 4 – 3D Point Cloud Display in Qinsy showing seafloor and in-water detection data from an Argos sonar.
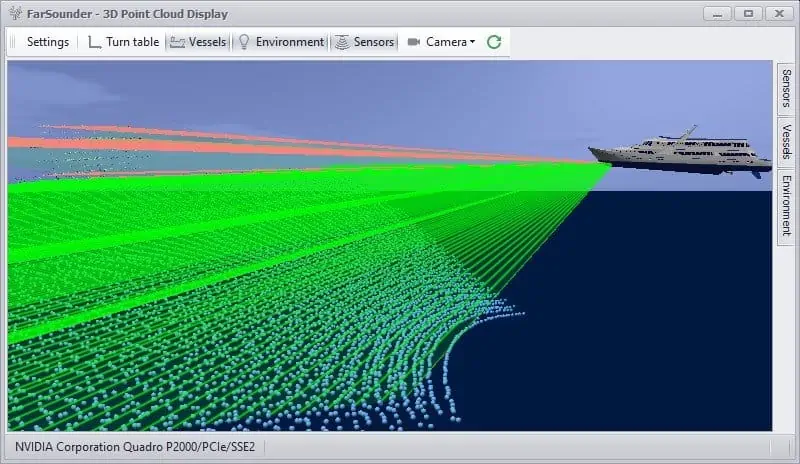
Figure 5 – 3D Point Cloud Display in Qinsy showing seafloor and in-water detection data from an Argos sonar, side view with “Ping Fan” activated in the display settings.
These views allow the user to get a closer look at the incoming data on a ping to ping level. For navigation or hydrographic data collection applications, the seafloor detections can be processed into a grid in real-time and displayed over an ENC using the Navigation Display, demonstrated in Figure 6.
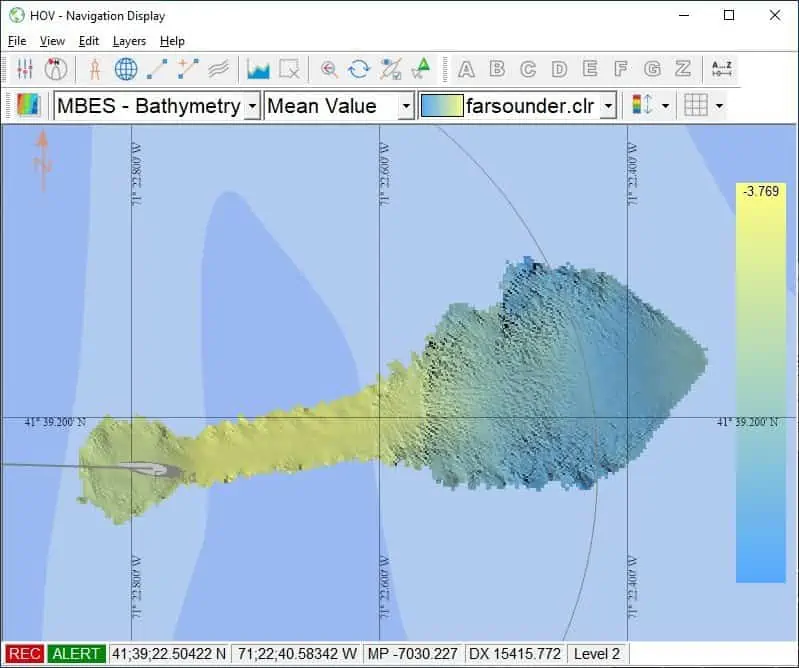
Figure 6 – The Navigation Display in Qinsy showing a sounding grid being updated in real-time as data streams into the system.
Of course, in-water detections from the system can also be displayed on the chart for navigation purposes in the same Navigation Display, as in Figure 7:
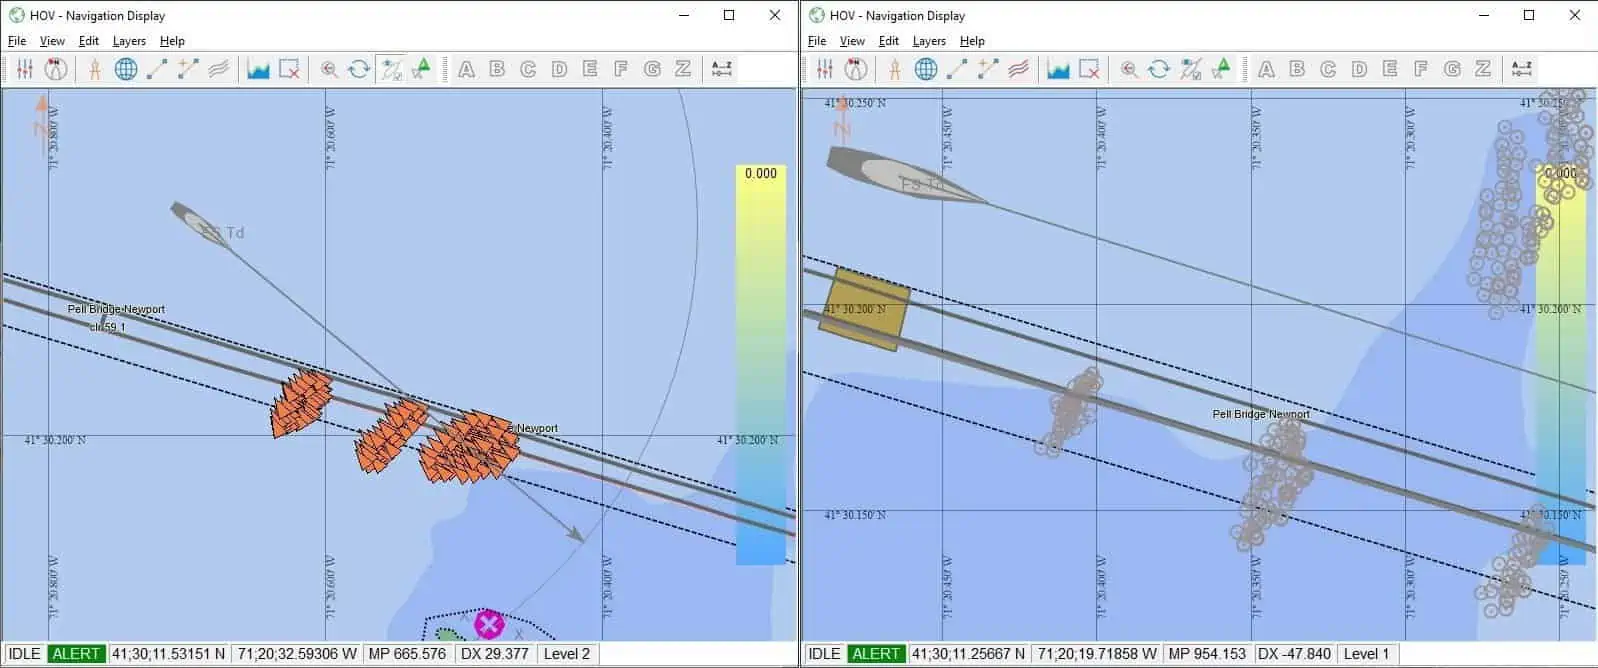
Figure 7 – The Navigation Display showing in-water target detections from the Argos system. Targets can be represented as ARPA targets (left, orange triangles) with configurable color, or as USBL targets (right, gray circles).
Figure 7 shows in-water target detections from an Argos sonar in the Qinsy Navigation Display using the two user configurable options for representation.
For FarSounder users looking to take a more detailed hydrographic look at the data collected using their Argos sonar, or even to incorporate that bathymetric data into their hydrographic workflow, Qinsy is an excellent choice. For Qinsy customers who have an Argos sonar installed for real-time navigation purposes, it is now possible to view data from all of their sonar systems and other sensors together into a unified hydrographic view in Qinsy.
In Summary
In either case, the integration of Argos sonar data in Qinsy offers users a more flexible and detailed view of the data they are collecting in real-time. Qinsy users with an existing FarSounder installation are already able to connect to the FarSounder system by simply following the instructions in their documentation, provided they are using Qinsy 9.2 or later.
To learn more please contact us at: [email protected]