

Recently, Sense Aeronautics has received inquiries about how its Automatic Target Recognition (ATR) capability for detecting individuals, vehicles, and drones differs from open-source alternatives available in public repositories.
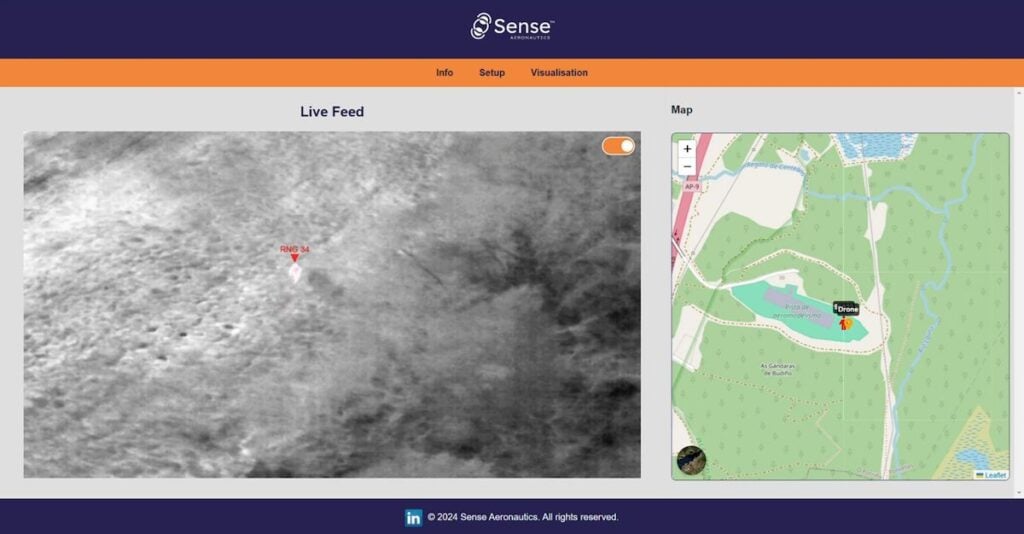
The most significant difference lies in the fact that the company’s ATR offering is more than just an AI model with enhanced detection and reduced false alerts – it is a complete video processing pipeline, ideal for drone fleet and swarm applications.
The ATR model accommodates a variety of formats, frame rates, and resolutions, all encapsulated within a single REST API, which can be deployed on various hardware configurations or in a cloud-based solution.
The Sense Aeronautics engineering team provides comprehensive support throughout each project phase, including custom developments tailored to specific needs.
Focusing purely on model performance, the company recently conducted a benchmark against state-of-the-art (SoA) models. The findings are detailed below.
The Importance of a Handpicked and Representative Dataset
A common approach when selecting data for benchmarking is to randomly sample videos not used during model training. Sense Aeronautics favored a more controlled process to ensure that the chosen videos accurately represent specific scenarios, or even particular clients.
The company used a carefully curated dataset provided by its partners, representative of real-world conditions. Each video was meticulously labeled by hand before being used to generate performance results.
The Method
The benchmark dataset was tested using two models: Sense Aeronautics’ proprietary ATR 1.0 and a pretrained model based on the YOLO architecture. The following performance metrics were employed:
- Detection Probability (PD) = TP / (TP + FN), where TP refers to True Positives and FN refers to False Negatives. This measures how accurately the model detects targets compared to the ground truth.
- False Alerts Per Second (FA/s) = FP / time (s), where FP refers to False Positives. This quantifies how frequently false alerts occur.
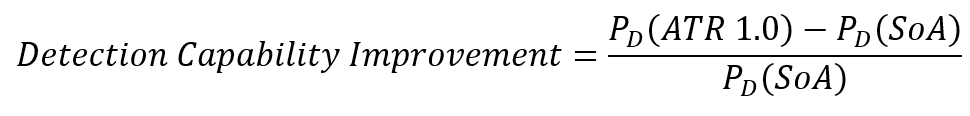
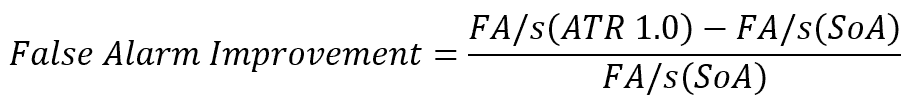
These metrics were calculated for each model: PD (ATR 1.0), PD (SoA), FA/s (ATR 1.0), and FA/s (SoA). Improvement in detection and false alert rates were then calculated as:
Targets were categorized based on their pixel area size to extract Detection Probability per size:
- Tiny: fewer than 576 square pixels.
- Small: fewer than 1024 square pixels.
- Medium: fewer than 9216 square pixels.
- Large: greater than 9216 square pixels.
Learn more about Sense Aeronautics’ Automatic Target Recognition (ATR) capability >>
Results
The benchmark results demonstrated significant improvements in the Sense Aeronautics ATR 1.0 model compared to the SoA model. Key findings include:
- Approximately the same detection probability (+1%) for large targets.
- A +18% detection probability increase for medium targets.
- A +285% detection probability increase for small targets.
- A +1430% detection probability increase for tiny targets.
- Half the number of false positives compared to the pretrained model.


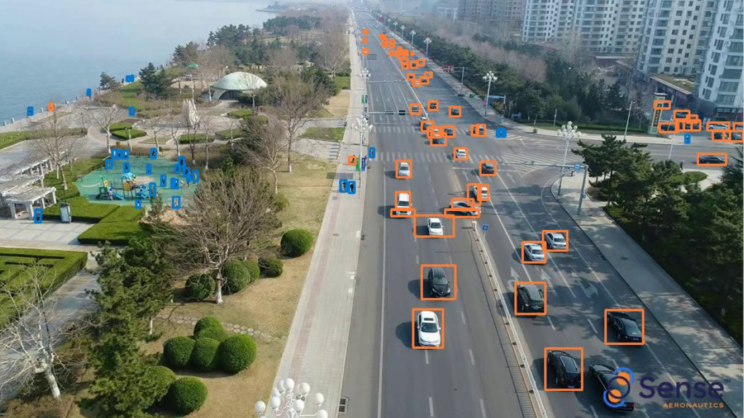
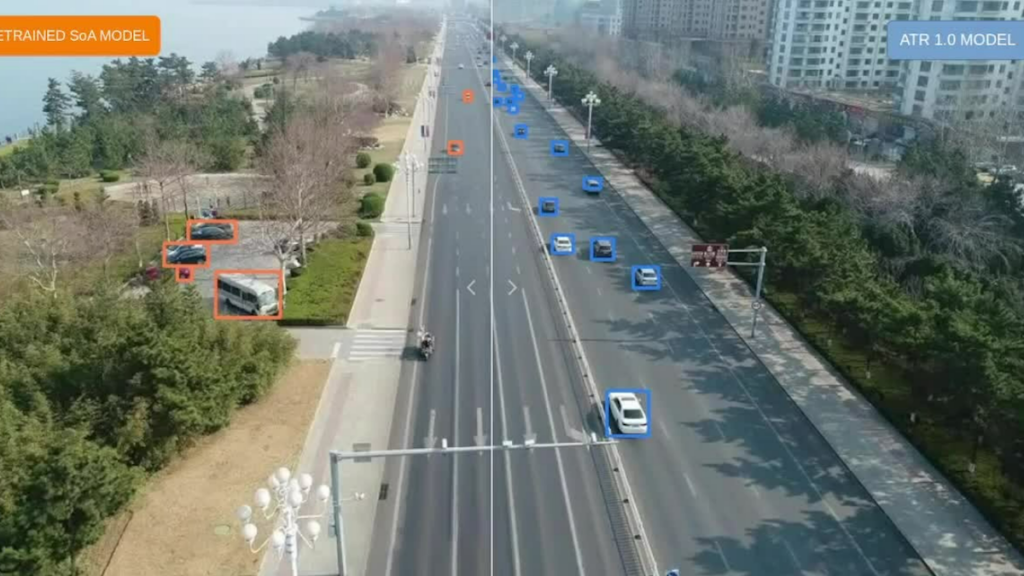
In addition to the quantitative results, the models were evaluated qualitatively by visualizing the bounding boxes around detected targets. In the image below, targets detected by both models are outlined in orange, while those detected solely by our ATR 1.0 model are outlined in blue.
It is clear that larger (closer) targets are detected by both models, whereas smaller (more distant) targets are detected only by ATR 1.0. Given the relationship between target size in pixels and distance, this improved ability to detect smaller targets also reflects an enhanced capacity to detect targets at greater distances.
Conclusion
Sense Aeronautics’ custom detection model not only enhances the detection of smaller objects but also significantly reduces false alerts, offering a more reliable solution compared to other off-the-shelf pretrained models.
Learn more about Sense Aeronautics’ Automatic Target Recognition (ATR) capability >>